WARNING: This is an experimental project. The data is real, but the interpretation is not to be relied upon.
Why
The goal of this project is simple: to bring greater transparency to the operational status of major public cloud services (and potentially other SaaS platforms). In today’s software-driven world, so much depends on the reliability of big cloud providers. While each of them offers a status page, it often paints a picture that looks perfect — perhaps a little too perfect.

How it works
The monitoring system is straightforward:
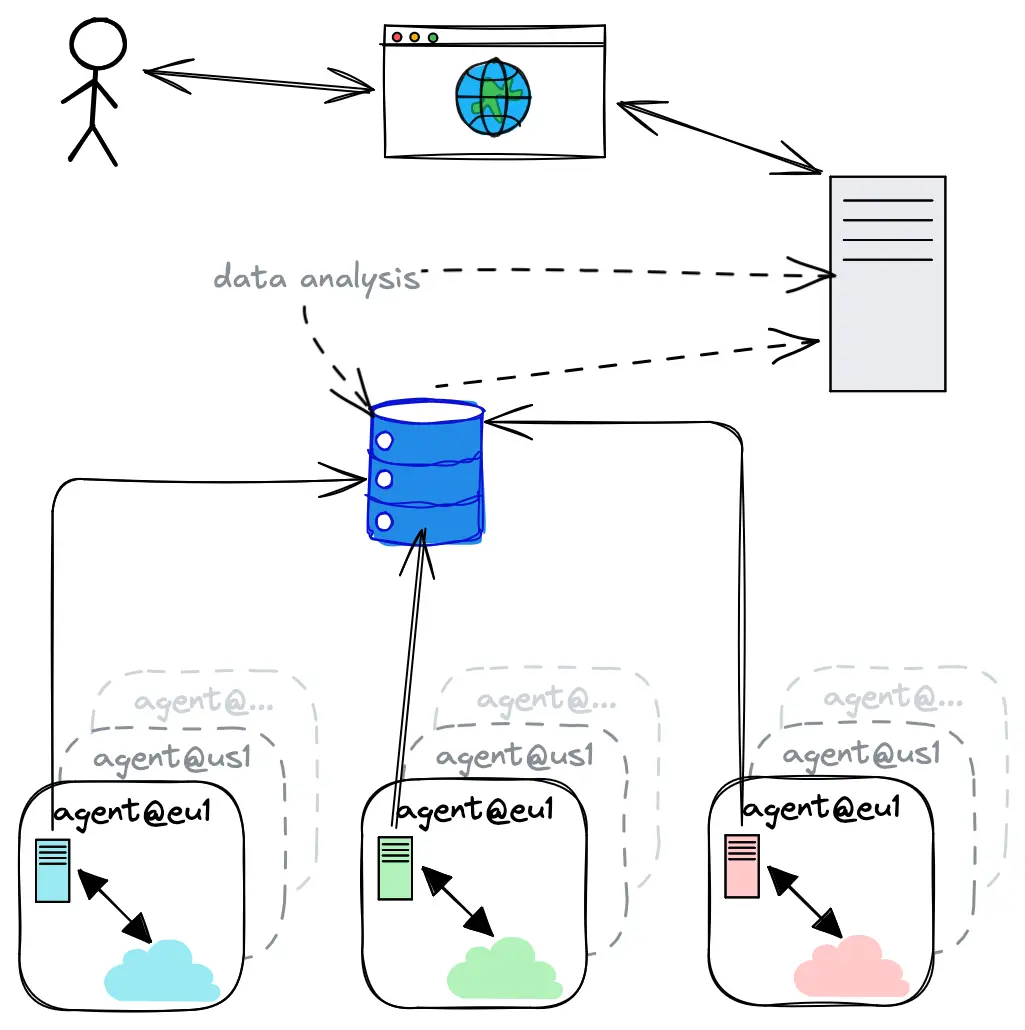
- Monitoring Agents: A simple monitoring agent is deployed in every region of each cloud (AWS, Azure, GCP).
- Periodic Probes: These agents regularly run "monitoring probes" - small tests that interact with various managed services in each cloud region.
- Official SDKs: Monitoring probes are simply calling cloud's APIs using their official SDKs.
- Regional Testing: All tests are performed within the same region as the monitoring agent so that reported latencies are purely regional.
- Data Collection: Results from these probes are asynchronously collected in a central database and displayed on this site.
- Continuous Analysis: Collected data are constantly analyzed for potential latency issues and probe failures. If something seems off, the system generates alerts, which could escalate into incidents (once verified).
Alert and incident severities:
- 🟨 Yellow: automated alerts triggered by increased latencies (can be caused by a problem within the monitoring system).
- 🟧 Orange: automated alerts triggered by probe failures (can be caused by a problem within the monitoring system).
- 🟥 Red: confirmed incident (something is wrong in the cloud).

Ideas
While it's not impossible to monitor everything all the time, this project wants to grow and is open to suggestions! If you feel that something needs to be monitored or have other ideas please let me know at daniel (at) kontsek.sk.
